INDIA - CHINA BORDER DISPUTE
Border Dispute:
- The India-China border is divided into three sectors:
- Western Sector: Aksai Chin, claimed by India but controlled by China.
- Middle Sector: Less contentious, but areas like Barahoti in Uttarakhand witness minor disputes.
- Eastern Sector: Arunachal Pradesh, claimed by China as part of South Tibet.
- The Sino-Indian War of 1962 remains a significant point of contention, with unresolved border claims.
Recent Standoffs
-
Doklam (2017):
- A 73-day standoff occurred at the tri-junction of India, China, and Bhutan.
- Triggered by Chinese road construction near Bhutanese territory, viewed as a threat to India's strategic Siliguri Corridor (Chicken’s Neck).
-
Galwan Valley (2020):
- Marked by the first casualties in 45 years; 20 Indian soldiers and an unknown number of Chinese troops died.
- Followed by a series of disengagement talks.
-
Eastern Ladakh (2020-present):
- Ongoing disputes in areas like Pangong Tso Lake, Depsang Plains, and Hot Springs.
- Despite disengagement in some areas, tensions persist.
The Line of Actual Control is a 4,057-kilometer-long (2,520 mile) disputed border line that separates Indian-controlled territory from Chinese-controlled territory in the Himalayan region. It runs through the disputed border regions of Ladakh, Aksai Chin, and other areas along the India-China border.
Key characteristics of the LAC include:
- Undefined Demarcation: Unlike most international borders, the LAC is not precisely demarcated or delineated. It is essentially a loose line of perception where both Indian and Chinese troops are positioned.
- Historical Context: The LAC emerged after the Sino-Indian War of 1962, which resulted in a ceasefire but did not resolve the underlying territorial disputes.
- Disputed Sections: There are multiple areas along the LAC where both countries have different perceptions of where the actual line should be, leading to occasional tensions and military standoffs.
- Strategic Importance: The region is geographically challenging, with high-altitude terrain including mountain passes, glaciers, and rugged landscapes.
- Periodic Tensions: In recent years, particularly in 2020, there have been significant military confrontations between Indian and Chinese troops, most notably in the Galwan Valley region of Ladakh.
The LAC is divided into three sectors:
- Western Sector (Ladakh)
- Middle Sector (Uttarakhand, Himachal Pradesh)
- Eastern Sector (Arunachal Pradesh)
Early Friendship (1947–1954)
-
Common Goals and Anti-Colonial Sentiments:
- India and China, as newly independent nations, sought to rebuild their societies and oppose colonialism and imperialism.
- Prime Minister Jawaharlal Nehru admired China’s cultural legacy and revolutionary transformation under the Communist regime led by Mao Zedong.
-
Support for China on the Global Stage:
- India was one of the first non-communist nations to recognize the People’s Republic of China (PRC) in 1949.
- Nehru supported China's entry into the United Nations, arguing that the PRC represented the Chinese people rather than Taiwan (Republic of China).
-
Signing of the Panchsheel Agreement (1954):
- India and China signed the Panchsheel Agreement, based on five principles of peaceful coexistence:
- Mutual respect for sovereignty and territorial integrity.
- Non-aggression.
- Non-interference in each other's internal affairs.
- Equality and mutual benefit.
- Peaceful coexistence.
- The slogan "Hindi-Chini Bhai-Bhai" symbolized the optimism in bilateral ties
- India and China signed the Panchsheel Agreement, based on five principles of peaceful coexistence:
Emerging Tensions (1954–1959)
-
The Tibetan Question:
- China's annexation of Tibet (1950–51) and its suppression of Tibetan uprisings created friction.
- India’s grant of asylum to the 14th Dalai Lama in 1959 after the failed Tibetan rebellion was viewed as interference by China.
-
Border Disputes:
- Despite the Panchsheel Agreement, India and China had unresolved territorial disputes:
- Aksai Chin (Western Sector): Controlled by China, claimed by India.
- Arunachal Pradesh (Eastern Sector): Claimed by China as South Tibet.
- Discovery of China's construction of a road in Aksai Chin (1957–58) intensified tensions
- Despite the Panchsheel Agreement, India and China had unresolved territorial disputes:
Deterioration and War (1959–1962)
-
Border Incursions and Skirmishes:
- China’s aggressive patrols and incursions along the Line of Actual Control (LAC) exacerbated hostilities.
- Nehru’s "Forward Policy" (establishing advanced Indian outposts along the disputed border) was seen as provocative by China.
-
Sino-Indian War (October–November 1962):
- China's invasion of Aksai Chin and parts of Arunachal Pradesh marked a turning point.
- The war exposed India's military vulnerabilities, resulting in territorial losses in Aksai Chin.
- China declared a unilateral ceasefire and withdrew from Arunachal Pradesh but retained control over Aksai Chin.
Differences Between the Terms
| Term | Scope | Focus | Finality |
|---|---|---|---|
| De-induction | Broader withdrawal | Long-term stability | Final withdrawal of troops |
| Disengagement | Specific sites/areas | Preventing skirmishes | Temporary or site-specific |
| De-escalation | Entire conflict zone | Reducing overall tensions | Long-term trust-building |
|
For Prelims: Current events of national and international importance.
For Mains: General Studies II: Bilateral, regional and global groupings and agreements involving India and/or affecting India’s interests.
|
|
Previous Year Questions
1.“Belt and Road Initiative” is sometimes mentioned in the news in the context of the affairs of : (UPSC CSE 2016)
(a) African Union (b) Brazil (c) European Union (d) China Answer (d)
The Belt and Road Initiative (BRI) is a global development strategy launched by China in 2013 under President Xi Jinping. It aims to enhance connectivity and cooperation among countries primarily in Asia, Africa, and Europe through infrastructure projects, investments, and trade networks. The BRI includes two main components:
BRI is often in the news due to its economic, geopolitical, and strategic implications for participating countries and its criticism for creating debt traps Mains 1.‘China is using its economic relations and positive trade surplus as tools to develop potential military power status in Asia’, In the light of this statement, discuss its impact on India as her neighbour. (UPSC CSE GS2, 2017) 2.With respect to the South China sea, maritime territorial disputes and rising tension affirm the need for safeguarding maritime security to ensure freedom of navigation and over flight throughout the region. In this context, discuss the bilateral issues between India and China. (UPSC CSE GS2, 2014) |
GDP AND GVA
1. Context
2. GDP and GVA
- GDP and GVA are two main ways to ascertain the country's economic performance. Both are measures of national income.
- The GDP measures the monetary measure of all "final" goods and services that are bought by the final user produced in a country in a given period.
- The GDP does this by adding up the total expenditures in the economy; in other words, it looks at who spent how much. That is why GDP captures the total "demand" in the economy.
- All the money Indians spent on their private consumption (that is, Private Final Consumption Expenditure or PFCE).
- All the money the government spent on its current consumption, such as salaries (Government, Final Consumption Expenditure or GFCE).
- All the money is spent towards investments to boost the economy's productive capacity. This includes business firms investing in factories or the governments building roads and bridges (Gross Fixed Capital Expenditure).
- The net effect of exports (What foreigners spent on our goods) and imports (what Indians spent on foreign goods) (Net Exports or NE).
- The GVA calculates the same national income from the supply side.
- It does so by adding up all the value added across different sectors.
| According to the RBI, the GVA of a sector is defined as the value of output minus the value of its intermediary inputs. This "value added" is shared among the primary factors of production, labour and capital. |
- By looking at GVA growth one can understand which sector of the economy is robust and which is struggling.
3. How are the two related?
- When looking at quarterly it is best to look at GVA data because this is the observed data.
- The GDP is derived by looking at the GVA data.
| The GDP and GVA are related by the following equation; GDP= (GVA)+ (Taxes earned by the Government)- (Subsidies provided by the government). |
- As such, if the taxes earned by the government are more than the subsidies it provides, the GDP will be higher than GVA.
- Typically, that is how it is. For the second quarter too, the GDP (at 38, 16, 578 crores) is much higher than the GVA (Which is at Rs 35, 05, 5999 crores).
- The GDP data is more useful when looking at annual economic growth and when one wants to compare a country's economic growth with its past or with another country.
4. GVA data
4.1 Manufacturing sector
- It is a contraction in the manufacturing sector. In Q2, manufacturing GVA declined by 4.3 per cent.
- This is significant because manufacturing carries a huge potential for job creation and can soak up excess labour from the agriculture sector.
- The contraction has meant that manufacturing GVA has grown by just 6.3 per cent over the three years since the Covid pandemic; look at the change between FY23 and FY20 in the Chart.
- However, it would be a mistake to believe that only Covid and its after-effects are responsible for the lacklustre manufacturing performance.
- The fact is, as borne by the data, manufacturing GVA grew by just 10.6 per cent between FY 17 and FY20.
- For perspective, it is important to remember that between FY14 and FY17, manufacturing GVA grew by 31.3 per cent.
- In other words, Indian manufacturing has been struggling to add value for the past six years.
- This would explain why data from the Centre for Monitoring Indian Economy (CMIE) shows that jobs in the manufacturing sector halved between 2016 and 2020.
4.2 Trade and hotels
- Almost 15 per cent growth in services such as trade and hotels etc.
- This is also a huge sector for job creation. But again, if one looks at the Q2FY23 level and compares it to the pre-Covid level (Q2 of FY20), the growth is barely over 2 per cent.
- That this sector grew by over 26 per cent in the three years between FY17 and FY20 when India was experiencing a serious economic declaration shows how badly it has been affected by the Covid disruption.
4.3 Mining and quarrying
- Another sector crucial for job creation, even though it is smaller in terms of overall contribution to India's GVA, is mining and quarrying it, too, has contracted by almost 3 per cent.
- Looking back over the past six years, it has contracted by 3.5 per cent between FY17 and FY20 and grown by just 2.5 per cent since then.
4.4 Agriculture
- One positive story emerging from the GVA pertains to agriculture (along with forestry and fishing), which has done better than expected by growing at 4.6 per cent.
- Typically, this is a good growth rate for this sector and has happened despite some worries that the sowing of crops did not happen in time.
- Overall, while the GVA has grown by 5.6 per cent year-on-year, the growth is just 7.6 per cent when compared to the pre-Covid level set in FY20.
5. GDP data
5.1 Private Consumption Expenditure
- GDP is the biggest engine of growth in private consumption expenditure.
- It typically contributes over 55 per cent of India's total GDP.
- This component is also crucial because if this is depressed, it robs the business of any incentive to make fresh investments; and expenditures towards investments are the second biggest contributors to the GDP, accounting for around 33per cent of the total.
- Data shows that private consumption has grown by a healthy 9.7 per cent over the past year.
- However, the growth is relatively modest just 11 per cent when compared over the last three years.
- That between FY 14 and FY17, this component grew by almost 28 per cent providing some perspective.
5.2 Investment expenditure
- The investment expenditures have grown by 10.4 per cent over FY21 and by almost 21 per cent between FY20 and FY23.
- This is the best growth over any three years going back to FY14.
- This suggests brighter prospects for the economy over the medium term.
5.3 Government final consumption expenditures
- The biggest surprise though from the GDP is the contraction in government final consumption expenditures.
- While these types of expenditures account for just about 10-11 per cent of the GDP, they can prop up an economy during tough times when people and businesses hold back spending.
- Oddly enough, data shows that not only did government consumption expenditure contract by 4.4. per cent in Q2 (Over the Q2 of 2021), but that it is almost 20 per cent below the pre-covid level.
5.4 Net Exports data
- The last component of the GDP equation is the Net Exports data.
- Typically, since India imports far more than it exports, the NX value is negative.
- In Q2, this negative value swelled by 89 per cent.
- Over the past three years, this drag on GDP has also increased in size by almost 150 per cent.
For Prelims and Mains
|
For Prelims: GDP, GVA, India's economic growth data, Net Exports data, Centre for Monitoring Indian Economy (CMIE), Government final consumption expenditures, Investment expenditure, Private Consumption Expenditure, Mining and quarrying, Agriculture, Trade and hotels, Manufacturing sector,
For Mains:
1. What is the difference between GDP and GVA and discuss their contributions to National development? (250 Words)
2. What are the engines of GDP growth? Explain the factors influencing economic growth. (250 Words)
|
|
Previous Year Questions
1.With reference to Indian economy, consider the following statements: (UPSC GS1, 2015)
1. The rate of growth of Real Gross Domestic Product has steadily increased in the last decade. 2. The Gross Domestic Product at market prices (in rupees) has steadily increased in the last decade. Which of the statements given above is/are correct? (a) 1 only (b) 2 only (c) Both 1 and 2 (d) Neither 1 nor 2 Answer (b)
2.A decrease in tax to GDP ratio of a country indicates which of the following? (UPSC GS1, 2015)
1. Slowing economic growth rate 2. Less equitable distribution of national income Select the correct answer using the code given below: (a) 1 only (b) 2 only (c) Both 1 and 2 (d) Neither 1 nor 2 Answer (a)
UPSC Mains Question
1.Define potential GDP and explain its determinants. What are the factors that have been inhibiting India from realizing its potential GDP? (UPSC GS3, 2020) 2.Explain the difference between computing methodology of India’s Gross Domestic Product (GDP) before the year 2015 and after the year 2015. (UPSC GS3, 2021) |
CLOUDBURST
1. Context
2. Cloudburst
- A cloudburst is a sudden and intense weather phenomenon characterized by a heavy and rapid release of precipitation from a cloud.
- This concentrated burst of rainfall can lead to flash floods, landslides, and other forms of water-related disasters in a very short period of time.
- Cloudbursts typically occur in areas with high humidity and convective activity, such as mountainous regions, coastal areas, and places prone to thunderstorms.
3. How do Cloud bursts Occur?
Cloudbursts typically occur in regions with convective activity, such as areas prone to thunderstorms, mountainous terrain, and coastal regions. They are often associated with towering cumulonimbus clouds, which are large and vertically developed clouds capable of generating intense rainfall and thunderstorms. Here's how a cloudburst happens:
- Formation of Cumulonimbus Clouds: Cloudbursts are most commonly associated with cumulonimbus clouds, which are towering clouds formed through the process of convection. Warm air near the Earth's surface rises, cools, and condenses into water droplets as it encounters cooler air at higher altitudes. This process leads to the formation of these large, vertically oriented clouds.
- Updrafts and Water Vapor: Inside a cumulonimbus cloud, strong updrafts of air carry water vapor from lower altitudes to higher altitudes within the cloud. As the air rises, it cools and the water vapor condenses into tiny water droplets or ice crystals.
- Collision and Coalescence: Within the cloud, water droplets and ice crystals collide and combine, forming larger droplets. As these droplets continue to collide and grow in size, they become too heavy for the updrafts to support, causing them to fall.
- Downdrafts: The larger water droplets and ice crystals begin to descend as downdrafts within the cloud. As they fall through the cloud, they can pick up additional moisture, further increasing their size.
- Precipitation Release: Eventually, the water droplets and ice crystals become large enough that the force of gravity overcomes the upward force of the updrafts, and they start to fall rapidly toward the Earth's surface. This is the point at which the cloudburst occurs. The droplets fall in large quantities over a relatively small area, resulting in intense rainfall within a short timeframe.
- Impact and Consequences: The rapid and concentrated release of precipitation from the cloudburst can overwhelm drainage systems, lead to flash floods, and trigger landslides, especially in areas with steep terrain. The intensity of the rainfall can result in immediate and severe flooding, causing damage to property, and infrastructure, and posing risks to human safety.
4. Causes of Cloud Bursts
- Atmospheric Instability: Cloud bursts often occur in regions with convective instability in the atmosphere. Convective instability refers to the situation where warm and moist air near the Earth's surface rises rapidly due to its lower density compared to the surrounding cooler air. This vertical motion can lead to the formation of towering cumulonimbus clouds that are capable of generating intense rainfall.
- Moisture Availability: The presence of abundant moisture in the atmosphere is essential for the formation of cloud bursts. When warm, moisture-laden air rises and condenses at higher altitudes, it releases latent heat, which further fuels the upward motion of air. This process can lead to the development of strong updrafts within clouds and the rapid accumulation of water droplets.
- Orographic Effects: Cloudbursts are often common in mountainous regions due to orographic lifting. When moist air is forced to rise over a mountain range, it cools and condenses, leading to the formation of clouds and potentially intense rainfall. The combination of orographic lifting and convective instability can enhance the likelihood of cloud bursts in these areas.
- Frontal Boundaries: Cloudbursts can also occur along frontal boundaries, where two air masses of differing temperatures and moisture content meet. The convergence of these air masses can create strong vertical motion and promote the development of thunderstorms and heavy rainfall.
- Cumulonimbus Clouds: Cloud bursts are often associated with cumulonimbus clouds, which are large and vertically developed clouds capable of generating intense weather. These clouds are formed through the process of convection, where warm air rises, cools, and condenses into cloud droplets. The presence of cumulonimbus clouds increases the likelihood of intense rainfall and thunderstorm activity.
5. Consequences of Cloud Bursts
- Flash Floods: One of the most immediate and dangerous consequences of a cloud burst is the occurrence of flash floods. The intense and concentrated rainfall from the cloud burst can overwhelm drainage systems, rivers, and streams, leading to rapid and widespread flooding. Flash floods can occur within minutes of the onset of heavy rainfall and pose a serious threat to lives, property, and infrastructure.
- Landslides and Mudslides: In hilly or mountainous regions, a cloud burst can saturate the soil, making it more susceptible to landslides and mudslides. The additional water weight, coupled with the steep terrain, can trigger the sudden movement of soil and rock, leading to dangerous landslides that can bury homes, roads, and communities.
- Property Damage: The rapid and intense nature of a cloud burst's rainfall can result in significant damage to homes, buildings, and infrastructure. Floodwaters can enter structures, causing structural damage, waterlogging, and destruction of personal belongings. Infrastructure such as roads, bridges, and utility systems can also be severely affected.
- Disruption of Services: Cloud bursts can disrupt essential services, including transportation, communication, and utilities. Flooded roads and bridges can make travel difficult or impossible, hampering emergency response and evacuation efforts. Power outages can occur if the electrical infrastructure is damaged by flooding or landslides.
- Health and Safety Risks: The flooding and contamination of water sources during a cloud burst can pose health risks to the affected population. Contaminated water can lead to the spread of waterborne diseases, and individuals may be at risk of injuries, drowning, or exposure to hazardous materials in floodwaters.
6. Mitigating Measures for Cloud Bursts
- Early Warning Systems: Implement effective early warning systems that can provide timely alerts about impending cloud bursts and heavy rainfall. These systems should be capable of reaching a wide audience through various communication channels, including mobile phones, sirens, and local media.
- Floodplain Zoning and Land Use Planning: Designate floodplain areas where development is restricted or regulated. Proper land use planning can help prevent construction in high-risk flood areas, reducing potential damage to property and infrastructure.
- Improved Drainage Infrastructure: Enhance drainage systems in urban and rural areas to handle sudden and intense rainfall. Well-designed drainage systems can help prevent water accumulation on roads and prevent flash floods.
- Erosion Control Measures: Implement erosion control measures, such as building retaining walls, stabilizing slopes, and using vegetation to prevent soil erosion in hilly and mountainous regions.
- Reservoirs and Dams: Construct reservoirs and dams to store excess water during heavy rainfall and release it gradually to prevent downstream flooding. Proper maintenance of these structures is essential to ensure their effectiveness.
- Green Infrastructure: Incorporate green infrastructure solutions such as permeable pavements, rain gardens, and rooftop gardens in urban planning. These measures can help absorb and manage excess rainwater, reducing the risk of flooding.
7. Conclusion
|
For Prelims: Cloudbursts, flash floods, landslides, Cumulonimbus Clouds, Water Vapour, Floodplain Zoning, Green Infrastructure.
For Mains: 1. What is a cloudburst, and how does it differ from regular rainfall? Explain the causes and meteorological factors that contribute to the occurrence of a cloudburst.
|
Previous year Questions1. Which of the following statements with regard to Cloudburst is/are correct? (UPSC CDS 2017)
1. It is defined as sudden localized very heavy downpour with cloud thunder and lightning.
2. It mostly occurs in the hilly areas.
3. It results in a very high intensity of rainfall, i.e., 250 mm-300 mm in a couple of hours.
4. It occurs only during the daytime.
Select the correct answer using the code given below.
A. 1, 2 and 3
B. 1, 3 and 4
C. 2 and 3 only
D. 2 only
Answer: A
|
RARE EARTH ELEMENTS
| The 17 rare earths are cerium (Ce), dysprosium (Dy), erbium (Er), europium (Eu), gadolinium (Gd), holmium (Ho), lanthanum (La), lutetium (Lu), neodymium (Nd), praseodymium (Pr), promethium (Pm), samarium (Sm), scandium (Sc), terbium (Tb), thulium (Tm), ytterbium (Yb), and yttrium (Y) |

- These elements are important in technologies of consumer electronics, computers and networks, communications, clean energy, advanced transportation, healthcare, environmental mitigation, and national defence, among others
- Scandium is used in televisions and fluorescent lamps, and yttrium is used in drugs to treat rheumatoid arthritis and cancer
- Rare earth elements are used in space shuttle components, jet engine turbines, and drones
- Cerium, the most abundant rare earth element, is essential to NASA’s Space Shuttle Programme
- In recent years, rare earths have become even more important because there has been an increase in demand for green energy
- Elements like neodymium and dysprosium, which are used in wind turbine motors, are sought-after more than ever as wind mills across the world continue to grow
- Moreover, the push for switching from internal combustion cars to electric vehicles has also led to a rise in demand for rare earth magnets made from neodymium, boron, and iron and batteries
- China has imposed restrictions on the export of seven rare earth elements (REEs) — dysprosium, gadolinium, lutetium, samarium, scandium, terbium, and yttrium — which are part of the 17 REEs.
- The country dominates the global refining of heavy REEs, giving it substantial control over critical supply chains, ranging from consumer electronics to defense. Although these measures do not constitute a complete export ban, they may cause temporary supply disruptions, as exporters navigate the permit process.
- India may not face an immediate disruption due to these restrictions. Despite government efforts to enhance domestic manufacturing of semiconductors and defense systems, the more sophisticated phases of production largely take place abroad, particularly in China and Japan. Japan, in anticipation of such issues, has already built stockpiles to buffer against REE-related supply shocks.
- Recognizing the strategic importance of REEs, India is aware that it holds around 6% of global deposits. However, the country’s capacity for mining and refining is minimal, largely due to the environmental challenges associated with such operations.
- India does extract some light REEs through its state-run firm, Indian Rare Earths Ltd, including monazite from coastal sands in Kerala. Nonetheless, imports still play a role.
- According to a recent statement by the Ministry of Mines in the Lok Sabha, India imported approximately 2,270 tonnes of REEs in 2023–24. Consequently, the national approach involves a mix of increasing domestic output and maintaining import channels
To support the strategic use of essential resources such as rare earth elements, India has launched the National Critical Mineral Mission (NCMM). This initiative aims to strengthen the country’s supply chain for critical minerals by boosting domestic production and establishing alternative international supply partnerships. According to a presentation by the Ministry of Mines in January, global events like China’s export restrictions, the Russia–Ukraine conflict, and other geopolitical factors have exposed vulnerabilities in the global critical mineral supply, underscoring the urgency of diversifying sources.
As part of the NCMM, the Indian government plans to oversee or support around 1,200 mineral exploration projects. It also intends to offer exploration licenses to encourage private sector participation and conduct auctions for additional critical mineral blocks
|
For Prelims: Applications of rare earths, rare earth elements
For Mains:
1.Europe’s largest known deposit of rare earth elements found in Sweden: Could the discovery change geopolitics?
|
|
Previous Year Questions
1.Recently, there has been a concern over the short supply of a group of elements called ‘rare earth metals’. Why? (2012)
Which of the statements given above is/are correct? (a) 1 only Answer (c)
|
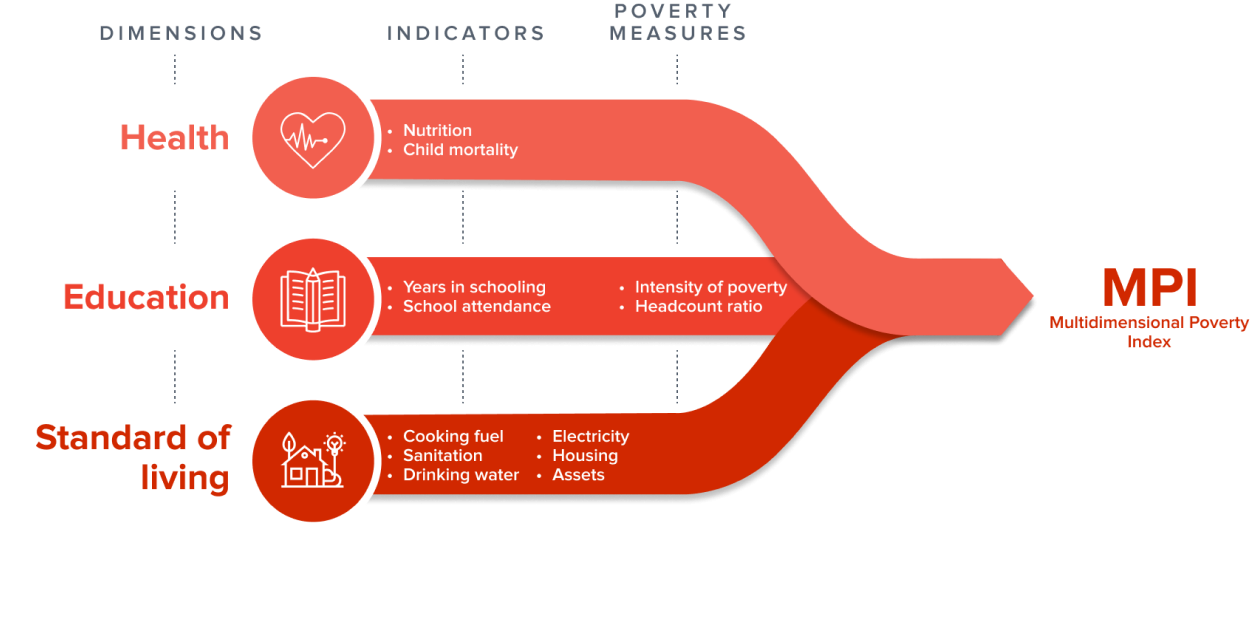
MULTIDIMENSIONAL POVERTY INDEX
The MPI is scored on a scale of 0 to 1, with 0 indicating no poverty and 1 indicating extreme poverty. A person is considered multidimensionally poor if they experience at least 33% of deprivations in the 10 dimensions.
The MPI was developed by the Oxford Poverty and Human Development Initiative (OPHI) and is now used by the United Nations Development Programme (UNDP) to track progress on multidimensional poverty reduction. The MPI is a valuable tool for understanding the nature of poverty and for designing policies that can effectively reduce it.
-
Health: This dimension considers indicators such as nutrition, child mortality, and access to clean water and sanitation.
-
Education: It looks at indicators like years of schooling and school attendance rates for children.
-
Standard of living: This dimension considers access to basic services like electricity, cooking fuel, and adequate housing.
- India still has more than 230 million people who are poor
- According to the MDI report, one should take the population “vulnerable” to multidimensional poverty seriously
- The UNDP defines, “Vulnerability — the share of people who are not poor but have deprivations in 20–33.3 percent of all weighted indicators — can be much higher.” India has some 18.7 per cent population under this category.
- Globally, 1.1 billion people, or around 18 per cent of total population, are acutely multidimensionally poor.
- Children under 18 years old account for half of MPI-poor people (566 million). The poverty rate among children is 27.7 per cent, while among adults it is 13.4 per cent
- 1.1 billion people in 110 developing countries are multidimensionally poor.
- The number of multidimensionally poor people has fallen by 220 million since 1990.
- The incidence of multidimensional poverty is highest in Sub-Saharan Africa and South Asia.
- Children are disproportionately affected by multidimensional poverty.
- Women are more likely to be multi-dimensionally poor than men.
|
For Prelims: Multidimensional poverty index, UNDP, Education, Health, Standard of Living
For Mains: Multidimensional poverty index
|
|
Previous year Questions
1.The Multi-dimensional Poverty Index developed by Oxford Poverty and Human Development Initiative with UNDP support covers which of the following? (UPSC CSE 2012)
Select the correct answer using the codes given below: (a) 1 only Answer - a 1.Despite Consistent experience of high growth, India still goes with the lowest indicators of human development. Examine the issues that make balanced and inclusive development elusive. (UPSC CSE 2016) |
SUSTAINABLE REPORT 2025

-
The 2025 Sustainable Development Report (SDR) highlights that none of the 17 Sustainable Development Goals (SDGs) are currently on course to be fully realized by 2030. Only 17% of the specific targets are advancing as intended. Factors such as conflicts, structural weaknesses, and limited fiscal capacity are hindering progress in many regions globally.
-
For the first time, the report introduced a simplified SDG Index (SDGi), employing one primary indicator per goal — a total of 17 — to monitor overall progress. This streamlined approach aims to reduce statistical distortions caused by missing data across countries.
-
A new metric — "Minimum dietary diversity among children aged 6 to 23 months" — has been added under SDG 2 (Zero Hunger), as noted in the SDR dataset.
-
The report identifies SDG 2 (Zero Hunger), SDG 11 (Sustainable Cities and Communities), SDG 14 (Life Below Water), SDG 15 (Life on Land), and SDG 16 (Peace, Justice, and Strong Institutions) as especially lagging. These goals are marked in red on dashboards, reflecting minimal or no progress since 2015.
-
The SDG Index is measured on a 0–100 scale, representing a country's proximity to achieving the SDGs. The gap between a nation’s score and 100 reflects the remaining distance to reach optimal performance.
-
Finland ranks first on the 2025 Index with a score of 87. European countries dominate the top 20 positions, occupying 19 of them. India has entered the top 100 for the first time, securing the 99th position with a score of 67. The country's rank has shown consistent improvement over recent years — from 109 in 2024, 112 in 2023, 121 in 2022, and 120 in 2021.
-
Regionally, India still lags behind some of its South Asian peers. Bhutan stands at 74th (70.5), Nepal at 85th (68.6), and the Maldives at 53rd. Sri Lanka is ranked 93rd, whereas Bangladesh and Pakistan are further behind at 114th and 140th respectively
| Rank 2025 | Country | Score 2025 |
| 1 | Finland | 87.0 |
| 2 | Sweden | 85.7 |
| 3 | Denmark | 85.3 |
| 4 | Germany | 83.7 |
| 5 | France | 83.1 |
| 98 | Belize | 67 |
| 99 | India | 67 |
| 100 | Mongolia | 66.7 |
| 159 | Niger | 50.3 |
| 158 | Madagascar | 51.0 |
- Sustainable development, as defined by the United Nations, refers to progress that addresses current needs without jeopardizing the ability of future generations to fulfill their own. The Sustainable Development Goals (SDGs) are an extension of the Millennium Development Goals (MDGs), which were introduced in 2000 with a target year of 2015.
- In India, the SDG Index assesses the performance of states and Union Territories (UTs) across a range of indicators such as health, education, gender equality, economic development, institutional strength, environmental sustainability, and climate action. Since its initial release in December 2018, the SDG India Index has become the primary tool for tracking the country’s advancement toward these global goals.
- Scores on the SDG India Index fall within a 0–100 scale, with higher scores indicating greater progress toward meeting the targets. States and UTs are grouped into four categories based on their scores: aspirants (0–49), performers (50–64), front-runners (65–99), and achievers (100). As per the NITI Aayog’s 2023–24 SDG Index, India achieved a score of 71.
- The 2030 Agenda for Sustainable Development, commonly referred to as Agenda 2030, is a global framework adopted by the United Nations. It comprises 17 SDGs that the international community aims to fulfill by the year 2030
-
At the United Nations Summit of the Future held in September 2024, member nations reaffirmed their dedication to the Sustainable Development Goals (SDGs) and to strengthening multilateral cooperation. The Summit concluded with the unanimous adoption of three major agreements: the Pact for the Future, the Global Digital Compact, and the Declaration on Future Generations.
-
The Summit of the Future (SoTF) was held on September 22–23, just prior to the United Nations General Assembly (UNGA) in New York. Its central theme was “multilateral solutions for a better tomorrow.”
-
UN Secretary-General António Guterres described the event as a “once-in-a-generation UN Summit,” emphasizing its historical significance as the UN marked its 80th anniversary in 2024.
-
In the 2025 edition of the Index of Countries’ Support to UN-Based Multilateralism (UN-Mi), Barbados secured the top position with a score of 92, followed closely by Jamaica. India was placed 113th with a score of 63.8. This index specifically evaluates nations’ commitment to multilateralism rooted in the UN system and does not account for contributions through other international forums such as BRICS, G20, G7, or OECD.
-
As noted in the Sustainable Development Report (SDR), the Pact for the Future outlines 56 action points focused on SDG implementation, global peace, and collective security. It also advocates for major reforms in the multilateral framework and the global financial system (United Nations, 2024).
|
For Prelims: Agenda 2030, Sustainable Development Report (SDR) 2025, Millenium development goals
For Mains: GS II - International reports
|
|
Previous Year Questions
1.Consider the following statements: (UPSC CSE 2016) 1. The Sustainable Development Goals were first proposed in 1972 by a global think tank called the ‘Club of Rome’. 2. The Sustainable Development Goals have to be achieved by 2030. Which of the statements given above is/are correct? (a) 1 only (b) 2 only (c) Both 1 and 2 (d) Neither 1 nor 2 Answer (b) 2.Sustainable development is described as the development that meets the needs of the present without compromising the ability of future generations to meet their own needs. In this perspective, inherently the concept of sustainable development is intertwined with which of the following concepts? (UPSC CSE 2010) (a) Social justice and empowerment (b) Inclusive Growth (c) Globalization (d) Carrying capacity Answer (d) |
PARLIAMENTARY ESTIMATE COMMITTEE
- Parliamentary committees serve as essential mechanisms to address the structural and technical challenges faced by large legislative bodies. Independent India adopted the committee system from the British Parliament and adapted it to suit the functioning of its own expansive legislature by introducing innovative methods to handle complex and voluminous tasks.
- The roots of India’s committee system can be traced back to the colonial period, with the establishment of the first parliamentary committee—the Public Accounts Committee (PAC)—in 1921, following the Government of India Act of 1919, also known as the Montford Reforms.
- Although the Constitution does not explicitly outline details regarding the structure, duration, or functioning of these committees, their legitimacy stems from Article 105, which outlines the privileges of Members of Parliament, and Article 118, which empowers Parliament to regulate its procedures and business through rules.
- The Rules of Procedure of the Lok Sabha provide the framework for setting up these committees. They may be appointed or elected by the House or nominated by the Speaker or Chairman, and they function under their guidance. Reports are submitted either to the House or directly to the Speaker/Chairman.
- Parliamentary committees enable legislators to dedicate focused time and attention to specific issues, allowing for detailed analysis. These bodies often consult experts and engage relevant stakeholders, encouraging a participatory approach that helps members from different political affiliations to find common ground on otherwise contentious matters
-
The Estimates Committee is a Financial Standing Committee comprising a maximum of thirty members, who are elected annually by the Lok Sabha through a system of proportional representation using the single transferable vote method.
-
Ministers are not eligible to be elected to this committee. In case a sitting member of the committee is appointed as a minister, their membership automatically ends from the date of their appointment.
-
The committee’s tenure is limited to one year. As per Rule 312 of the Lok Sabha, the committee is permitted to examine budget estimates periodically throughout the financial year and submit reports to the House as the review progresses. It is not mandatory for the committee to assess the complete set of estimates in a single financial year.
- Recommend potential cost savings, organizational improvements, administrative reforms, or enhancements in efficiency that align with the objectives behind the estimates;
- Propose alternative policy measures aimed at improving administrative efficiency and reducing expenditure;
- Assess whether the allocated funds are being utilized effectively, within the boundaries of the policies reflected in the estimates; and
- Recommend the appropriate format in which the estimates should be submitted to Parliament.
- The Committee’s jurisdiction does not extend to Public Sector Undertakings that fall under the purview of the Committee on Public Undertakings, as defined by the Lok Sabha Rules of Procedure or directives issued by the Speaker
6. Different types of parliamentary committee
-
In general, Parliamentary Committees are categorized into four types: Financial Committees, Departmentally Related Standing Committees (DRSCs), Other Standing Committees, and Ad hoc Committees.
-
The Financial Committees comprise the Estimates Committee, the Public Accounts Committee, and the Committee on Public Undertakings. These were established in the year 1950.
-
The concept of Departmentally Related Standing Committees was introduced in 1993 under the speakership of Shivraj Patil. Initially, 17 such committees were formed to review budget allocations and key policy initiatives, thereby enhancing legislative oversight and enabling deeper involvement of members in law-making. The number was later increased to 24. Each committee consists of 31 members—21 from the Lok Sabha and 10 from the Rajya Sabha.
-
Ad hoc Committees are temporary in nature, created to fulfill a specific objective. Once their assigned task is complete and a report is submitted to the House, these committees are dissolved. Notable examples include Select and Joint Committees on Bills, as well as others like the Railway Convention Committee and the Committee on Food Management and Security within the Parliament House Complex.
-
Parliament also has the authority to form a Joint Parliamentary Committee (JPC), comprising members from both Houses, to conduct detailed investigations into specific issues or legislation. Similarly, either House may establish a Select Committee with members solely from that chamber. Typically, such committees are chaired by members of the ruling party and are disbanded upon the submission of their final reports
| Committee | Number of Members | Member nominated or elected | |
| Financial Committee | Public Accounts Committee | 22(15LS+7RS) | Elected by both the House (s)
(set up in 1921) |
| Estimates Committee | 30 (LS) | Elected by the Lok Sabha
(set up on the recommendation of John Mathai, the then Finance Minister) |
|
| Committee on Public Undertakings | 22(15LS+7RS) | Elected by both the House (s)
(created in 1964) |
|
For Prelims: Parliamentary Committees, Rajyasabha proceedings, Ethics Committee
For Mains: GS II - Indian Polity and Governance
|
|
Previous Year Questions
1.Which one of the following is the largest Committee of the Parliament? (UPSC CSE 2014)
(a) The Committee on Public Accounts (b) The Committee on Estimates (c) The Committee on Public Undertakings (d) The Committee on Petition Answer (b)
|


