
HOUSEHOLD CONSUMPTION EXPENDITURE SURVEY (HCES)
1. Context
The Ministry of Statistics and Programme Implementation (MoSPI) decided to conduct two consecutive surveys on household consumption expenditure during 2022-23 and 2023-24, once situation normalized after the Covid-19 pandemic
2. Household Consumption Expenditure Survey (2023-24)
- The Ministry of Statistics and Programme Implementation (MoSPI) initiated two consecutive surveys on household consumption expenditure for 2022-23 and 2023-24, following the normalization of conditions after the COVID-19 pandemic.
- The first survey, conducted from August 2022 to July 2023, had its summary results published as a factsheet in February 2024, with the detailed report and unit-level data released in June 2024.
- The Household Consumption Expenditure Survey (HCES) gathers data on household spending on goods and services, offering insights into economic trends, poverty, inequality, and social exclusion.
- It also updates the basket of goods and weights for the Consumer Price Index. The Monthly Per Capita Consumption Expenditure (MPCE) derived from the HCES serves as a crucial indicator for analytical purposes
3. Key takeaways from Household Consumption Expenditure Survey (HCES) 2023-24
- The estimated average Monthly Per Capita Consumption Expenditure (MPCE) for 2023-24 in rural and urban India is Rs. 4,122 and Rs. 6,996, respectively, excluding the value of items received for free through social welfare programs. When the imputed value of these free items is considered, the estimates rise to Rs. 4,247 for rural areas and Rs. 7,078 for urban areas.
- In nominal terms, the average MPCE (without imputation) grew by approximately 9% in rural areas and 8% in urban areas compared to 2022-23 levels. The urban-rural MPCE gap has also narrowed, decreasing to 70% in 2023-24 from 71% in 2022-23 and 84% in 2011-12, reflecting consistent consumption growth in rural areas.
- The largest increase in average MPCE from 2022-23 to 2023-24 occurred among the bottom 5-10% of the population in both rural and urban areas. Following the trend from the 2022-23 HCES, non-food items accounted for the majority of household expenditure in 2023-24, comprising about 53% of MPCE in rural areas and 60% in urban areas.
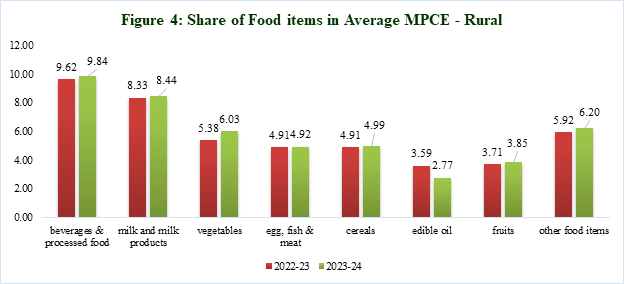
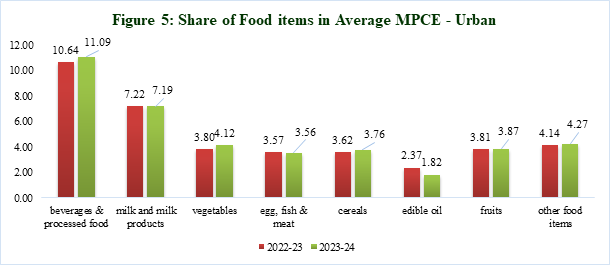
- Within the food category, beverages, refreshments, and processed foods continued to dominate household spending in 2023-24. Non-food expenditure remained concentrated in categories such as conveyance, clothing, bedding, footwear, miscellaneous goods, entertainment, and durable goods. For urban households, rent—including house rent, garage rent, and accommodation charges—accounted for around 7% of non-food expenditure.
- Consumption inequality has decreased in both rural and urban areas. The Gini coefficient for rural areas declined from 0.266 in 2022-23 to 0.237 in 2023-24, while in urban areas, it fell from 0.314 to 0.284 during the same period
4. Consumption behaviour in Indian household
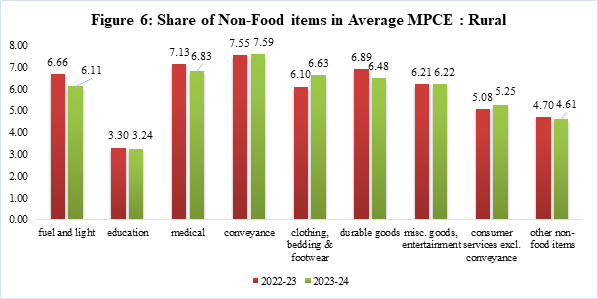
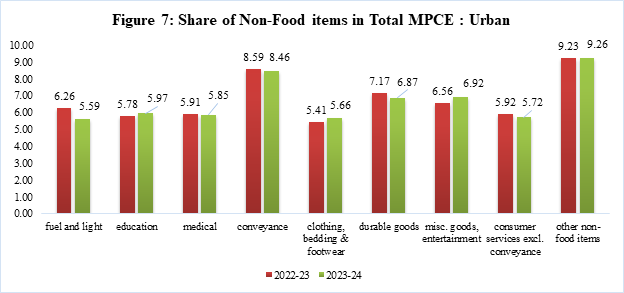
- Households across all States and Union Territories spend a larger portion of their budget on non-food items, with non-food expenditure accounting for 53% of the average MPCE in rural areas and 60% in urban areas.
- The key areas of non-food spending in 2023-24 include: (i) Conveyance, (ii) clothing, bedding & footwear, (iii) miscellaneous goods & entertainment, and (iv) durable goods. In urban areas, rent makes up around 7% of non-food expenditure.
- As in 2022-23, beverages and processed foods remain the largest contributors to food expenditure in 2023-24, followed by milk and milk products, and vegetables.
- A comparison of the contribution of various item categories to household consumption expenditure in both rural and urban areas for 2022-23 and 2023-24 is provided in Figures 4, 5, 6, and 7
5. Way Forward
The analysis of household consumption expenditure in India for 2023-24 highlights significant trends and shifts in both rural and urban areas. Non-food expenditure continues to dominate, with key contributors being conveyance, clothing, durable goods, and rent in urban areas. The increase in consumption, particularly in rural areas, demonstrates the sustained momentum of economic growth and development. Food expenditure remains largely driven by beverages, processed foods, and dairy products. The decline in consumption inequality, as reflected by the reduction in the Gini coefficient, further indicates positive changes in income distribution. These findings underscore the ongoing progress towards improving the economic well-being of households across India, with particular emphasis on balancing development and consumption patterns in both rural and urban regions
|
For Prelims: Current events of national and international importance For Mains: General Studies III: Indian Economy and issues relating to planning, mobilization, of resources, growth, development and employment |
Source: Pib


